
If you’re looking for a way to visually analyze geospatial data, you might be interested in a new software development kit (SDK) recently released by Cambridge Intelligence. Dubbed MapWeave, the software enables developers to build geospatial visualization capabilities directly into applications, thereby enabling users to uncover hidden connections and patterns buried in data.
Cambridge Intelligence was founded in 2011, when British data visualization expert Joe Parry decided the market needed more lightweight, user-friendly tools. After boostrapping Cambridge Intelligence in his kitchen, Parry, who earned at PhD while working in Stephen Hawking’s research group, moved into the University of Cambridge’s accelerator program, ideaSpace.
After graduating from ideaSpace, the company launched its first product, called KeyLines, which is a JavaScript-based SDK for visualizing graph data that is stored in graph databases, such as Neo4j and TigerGraph, and semantic knowledge graphs, such as Stardog and Memgraph. Cambridge Intelligence followed with the launches of ReGraph, a graph visualization SDK for React, and KronoGraph, a JavaScript toolkit for building timeline visualizations and analysis of time-series data.

Cambridge Intelligence Founder and Chairman Joe Parry
The company found numerous customers for its link analysis and time-series analysis tools in the defense, intelligence, cybersecurity, and financial services industries. Customers include the US Army, the US Department of Homeland Security, the British and Dutch governments, FICO, Experian, Deloitte, Intuit, and Solar Winds. The UK company has attracted 280 customers in more than 35 countries over its 14 years of existence, and has also established technology partnerships with companies like Neo4j, Amazon, and Microsoft.
This month’s launch of MapWeave marks the company’s fourth major product and its first developer library devoted to the analysis of geospatial data. According to Dan Williams, Cambridge Intelligence’s chief product officer, the company saw a data analysis need in the market that wasn’t being adequately addressed by existing Geographic Information Systems (GIS) systems.
“Traditional GIS tools are great at showing where things happen–but not why,” Williams writes in a May 8 blog post. “They weren’t built to help analysts understand changing connections between people, places, and events.”
MapWeave addresses that need by providing geospatial link analysis capabilities that allow analysts to better understand how people or objects move, relate, and interact through time and space, as well as how entities are connected–all through a dynamic map interface. The software also helps users by showing them when and where important events occur, and also how spatial patterns emerge over time.
MapWeave was designed to work with Cambridge Intelligence’s other SDKs for graph and time-series data, including KeyLines, ReGraph, and KronoGraph. Analysts working in security, anti-fraud, and intelligence domains will be able to layer geospatial analytics capabilities on top of existing graph and time-series analysis.
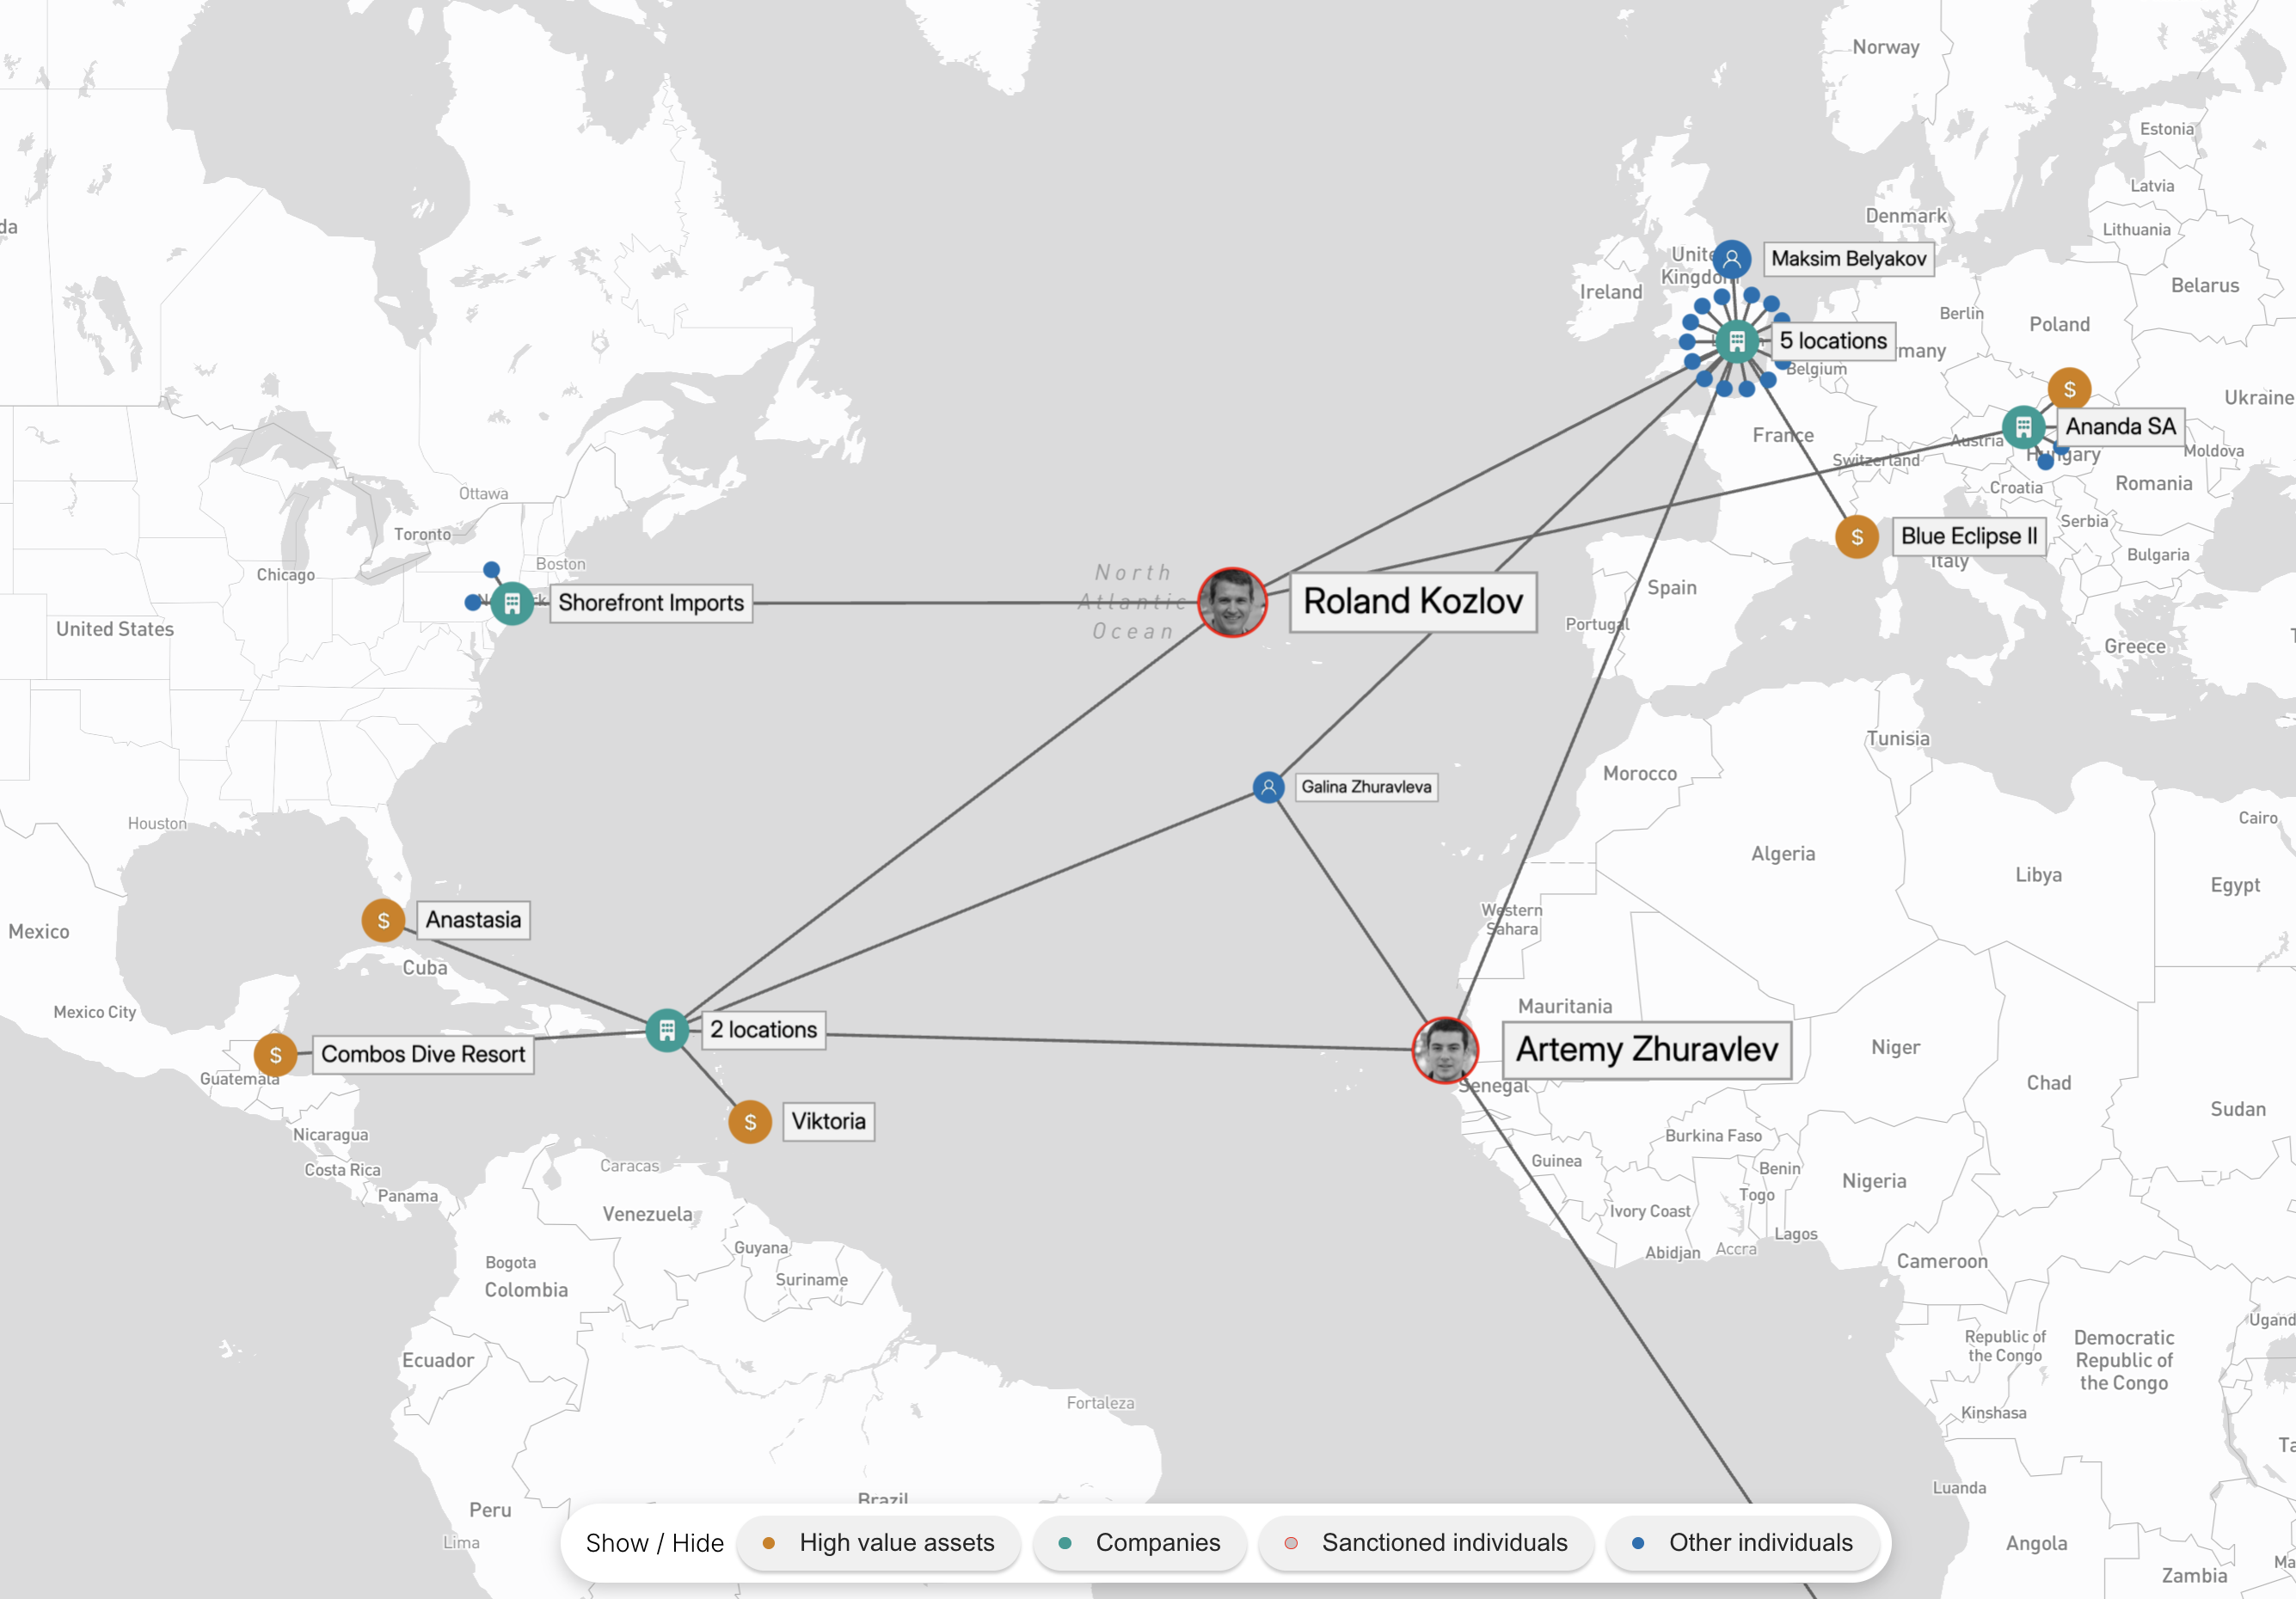
MapWeave lets developers build geospatial analytics dashboards that can be integrated into Web applications
“MapWeave enables state-of-the-art visualizations by mixing network, observation, and geoJSON layers,” the company says in a MapWeave white paper. “This integration allows users to analyze geographic, network, and temporal data simultaneously, providing a comprehensive view that answers multiple questions in a single, integrated map. It empowers users to visualize complex data with ease and precision.”
While it can integrate with other company frameworks, MapWeave can also be used in “standalone” mode without external dependencies. The software features an open architecture, Cambridge Intelligence says, and it works with a range of basemap providers, such as Mapbox or any other source of JSON data, including popular databases like Neo4j, Oracle, or MongoDB.
Developers get started by choosing a data source, which can be basemap libraries, vector or raster images, or map tiles. MapWeave then allows the developers to overlay visualization layers atop that base data to create the specific geospatial analytics experience they desire.
MapWeave features a simple JavaScript API (as well as a React API). Visualizations created with MapWeave can be embedded into existing Web applications using the JavaScript API or as a React component (there is also optional Typescript support). It works with standard JavaScript frameworks like Angular and Vue.
Cambridge Intelligence says MapWeave was designed to handle very large geospatial data sets. Its rendering and filtering capabilities can be goosed with GPUs, enabling customers to scale to millions of timestamped observations, the company says.![]()
The company developed MapWeave in a dynamic manner to enable users to zoom their screens in and out as needed, without worrying about sizing every item; it’s all handled automatically by the software. “Whether examining local detail or global trends, users always see the right data at the right time, supporting efficient and effective analysis,” the company says.
The company says MapWeave will be useful for a range of geospatial analysis projects, such as visualizing Automatic Identification System (AIS) data generated by ocean-going vessels for maritime intelligence; analyzing addresses and events on the ground as part of law enforcement or open source intelligence (OSINT) investigations; visualization of network performance and fault data for IT observability; visualizing online threats as part of cybersecurity work; building digital twins of supply chains for logistical resilience; and tracking emergency service routes as part of government transportation endeavors.
Cambridge Intelligence offers trials for MapWeave, as well as customer support options. For more info, check out the company’s website at cambridge-intelligence.com.
Related Items:
How Geospatial Data Drives Insight for Bloomberg Users
Location Solves Just Part of the Geospatial Challenge